The collision lab will help students understand how preservation of momentum works in collisions of various elasticity. While the lab starts with four separate collisions, it is encouraged for students to try other configurations.
This lab was adapted from TJHSST’s collision lab.
Setup
Load the collisionlab.lua file using the “Load World” button in the top menu: 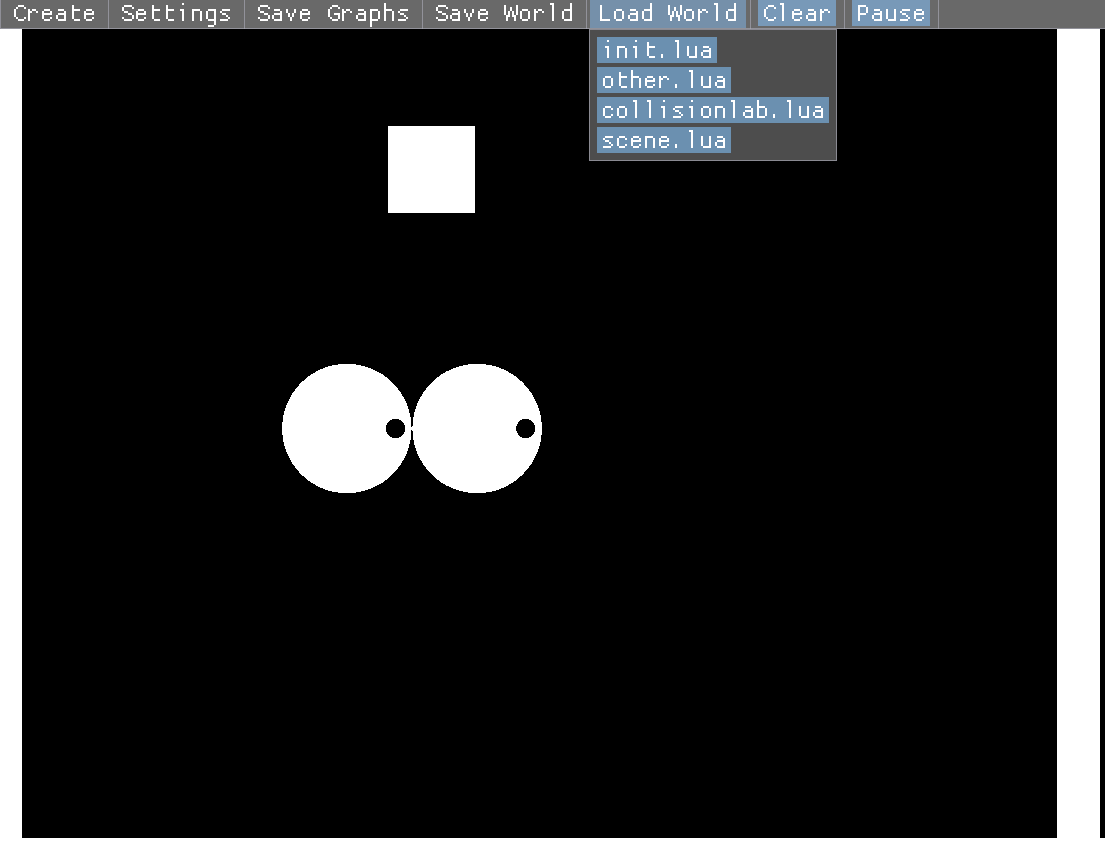
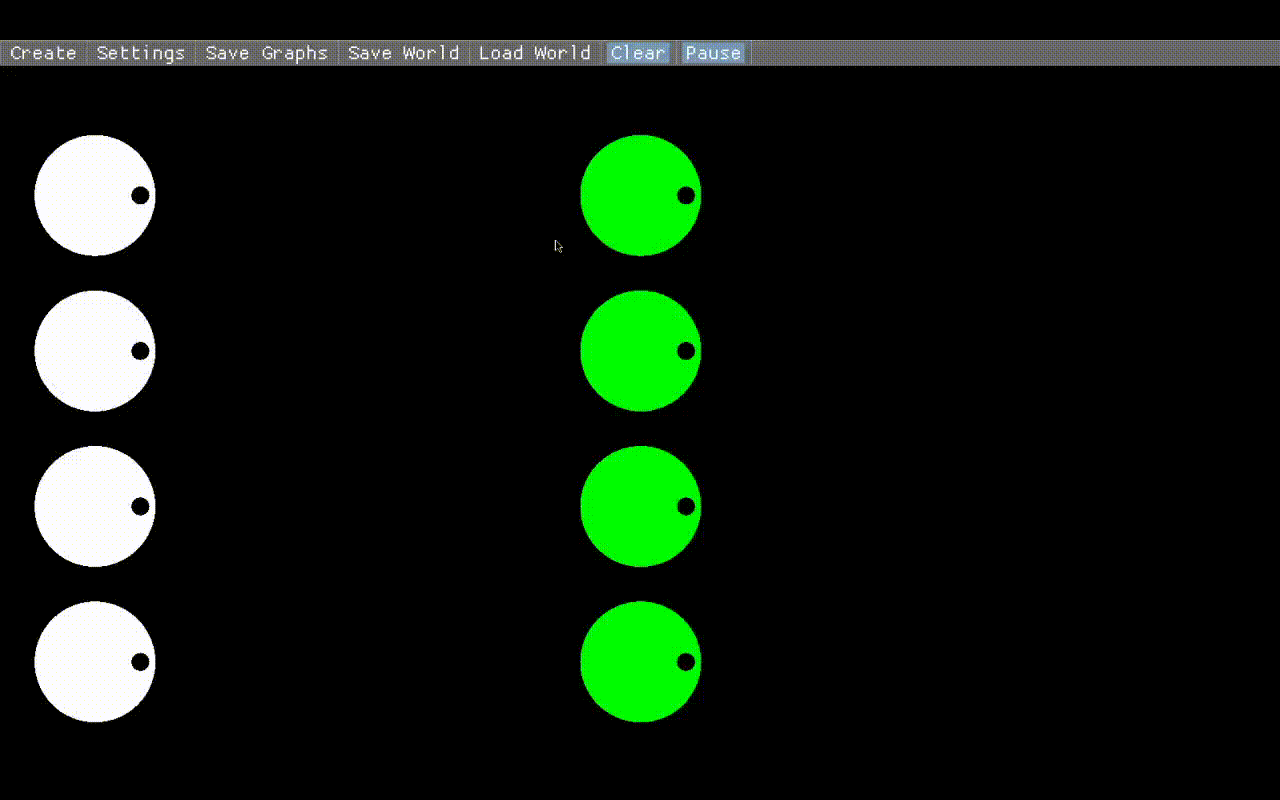
You should see something like this: 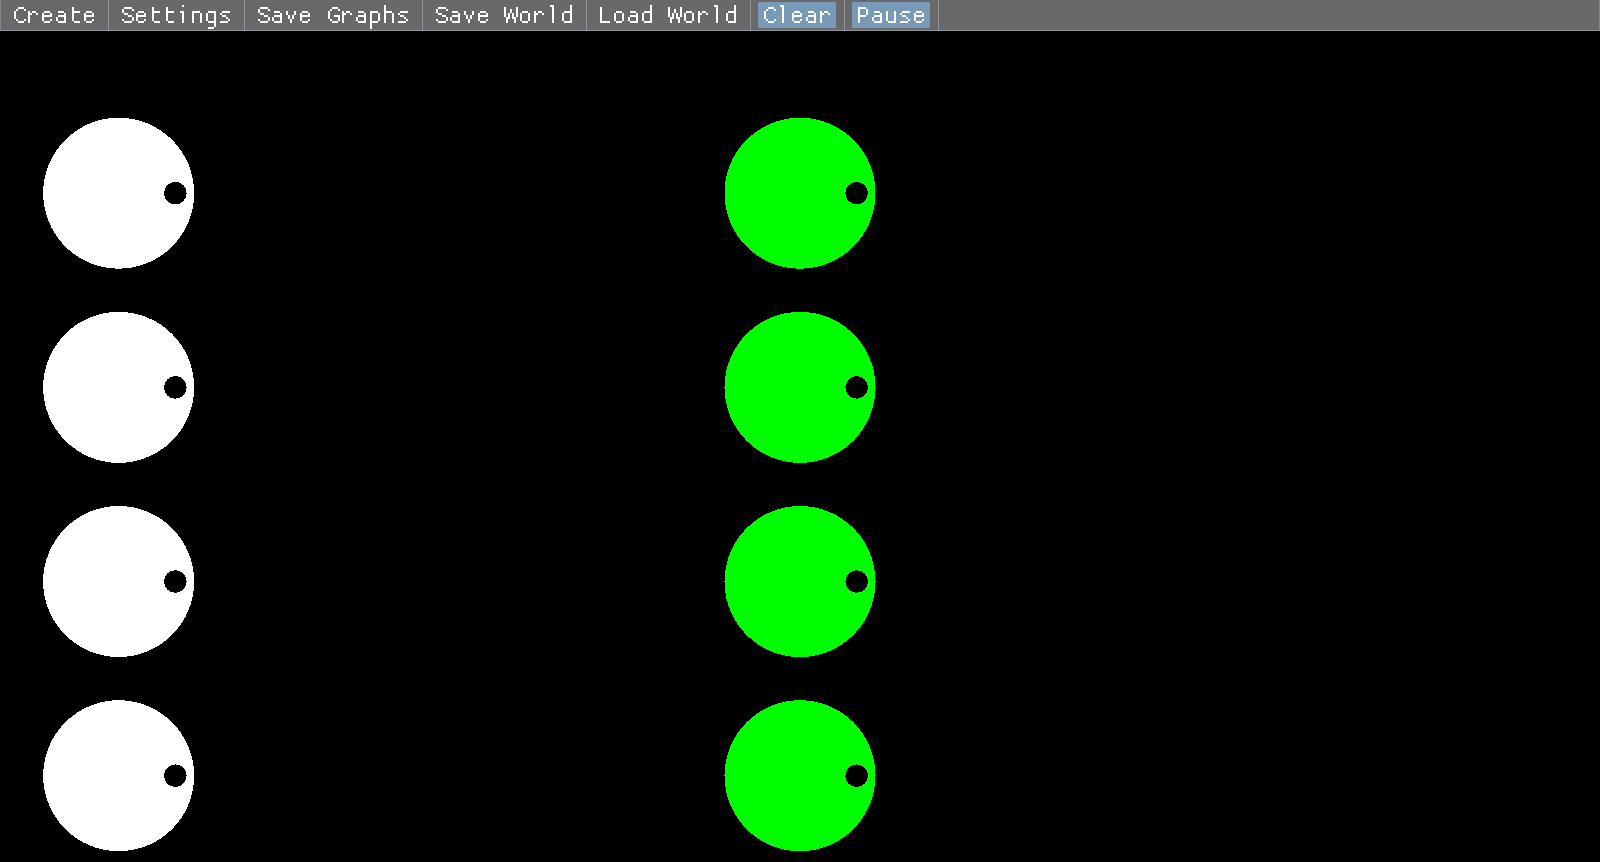
The scene is paused on load in. To play the scene, press the pause button at the top or press space. 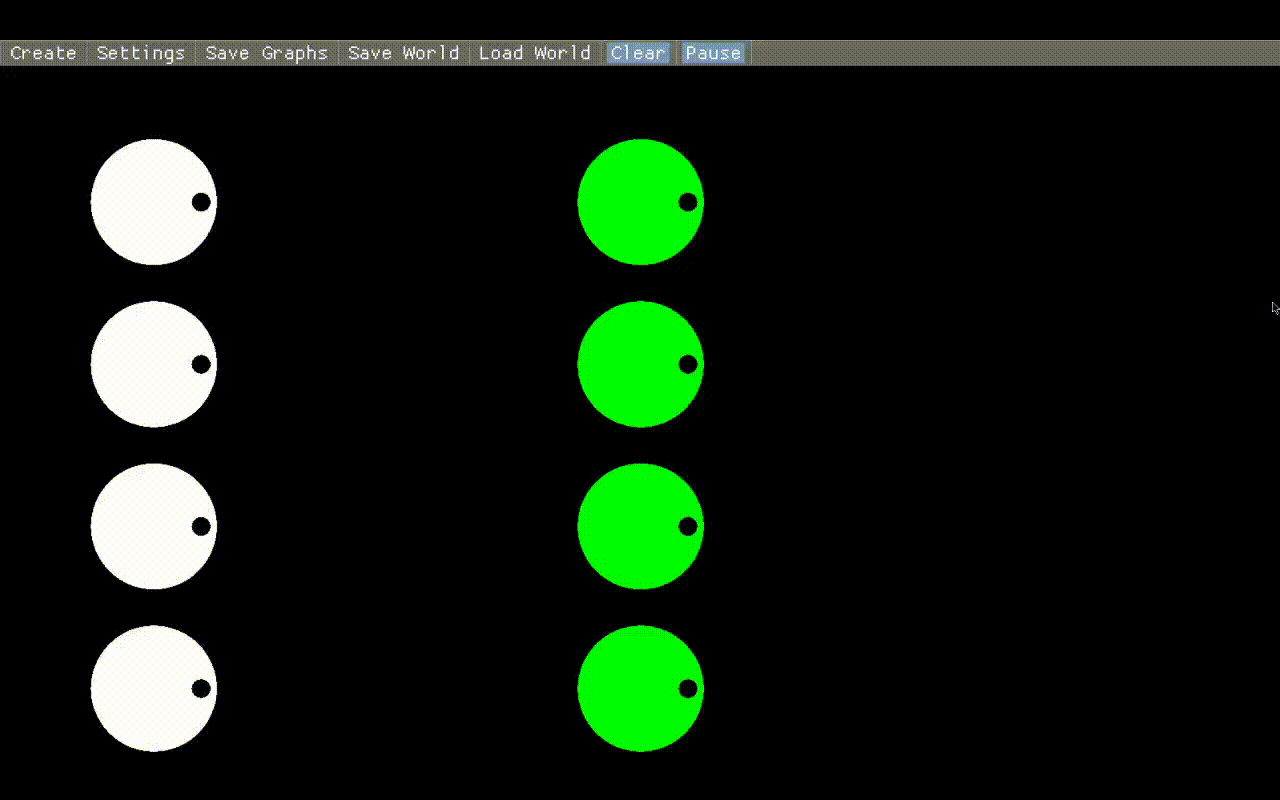
Reset by reloading the scene with the “Load World” button again. Each row of shapes has two masses. The mass on the left is Mass A. The mass on the right is Mass B. When the simulation runs, Mass A wil fly towards Mass B to demonstrate the physics of collisions.
This table contains the initial properties of each shape on each row:
| Row | Mass A Velocity | Mass A Elasticity | Mass A Mass | Mass B Velocity | Mass B Elasticity | Mass B Mass |
|---|---|---|---|---|---|---|
| 1 | 5 | 1.0 | 1.0 | 0.0 | 1.0 | 1.0 |
| 2 | 5 | 1.0 | 1.0 | 0.0 | 1.0 | 5.0 |
| 3 | 5 | 0.0 | 1.0 | 0.0 | 0.0 | 1.0 |
| 4 | 5 | 0.0 | 1.0 | 0.0 | 0.0 | 5.0 |
The Lua code is very understandable even if you don’t know how to code. It’s encouraged to change some values and look at the results.
Collecting Data:
For each of the four rows:
- Reload the scene.
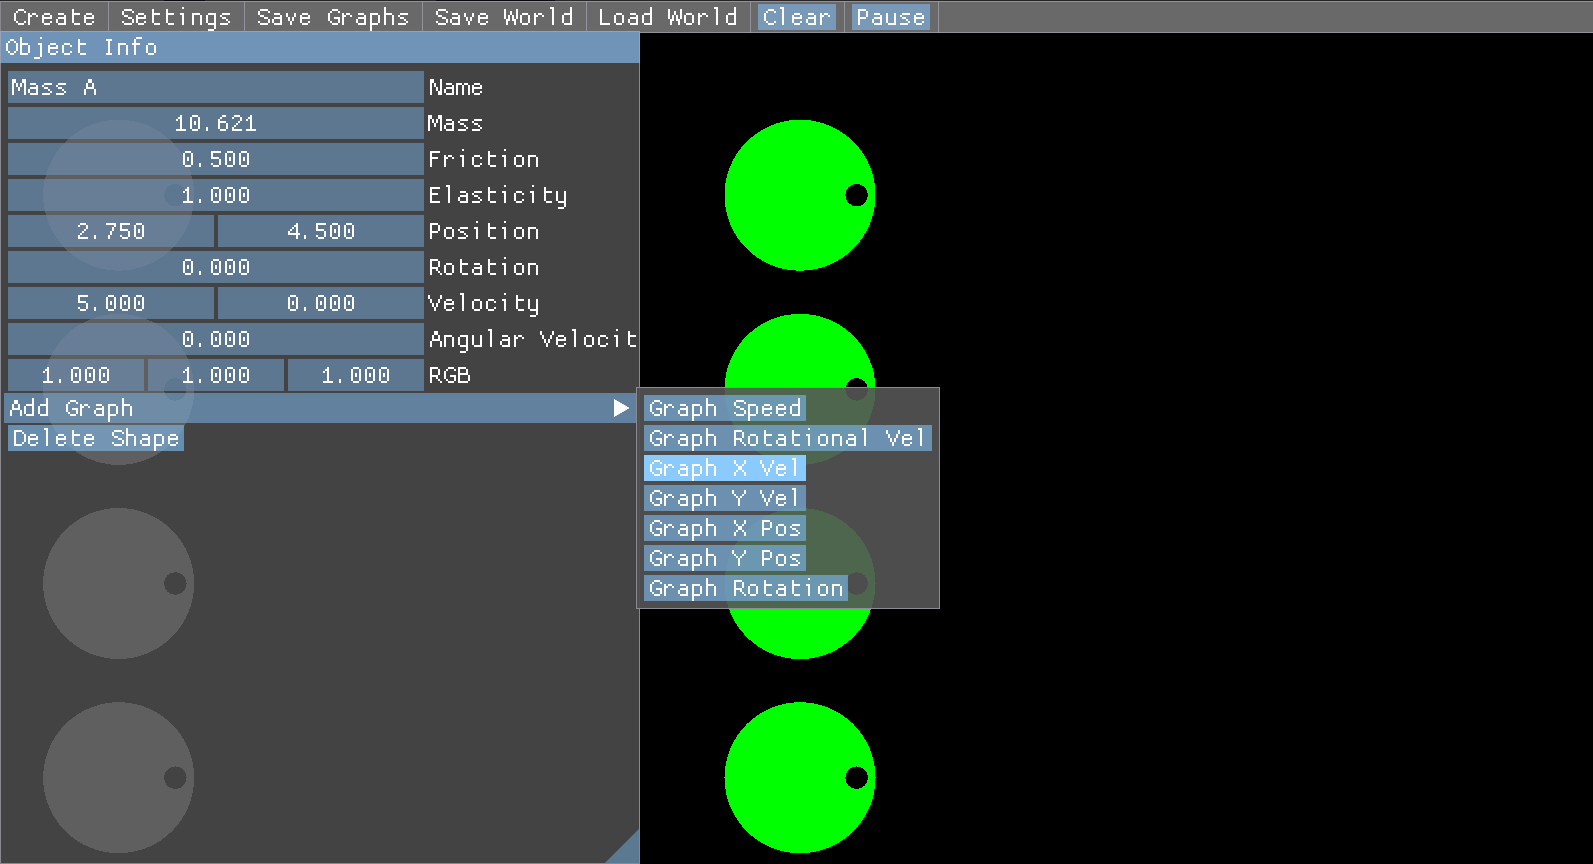
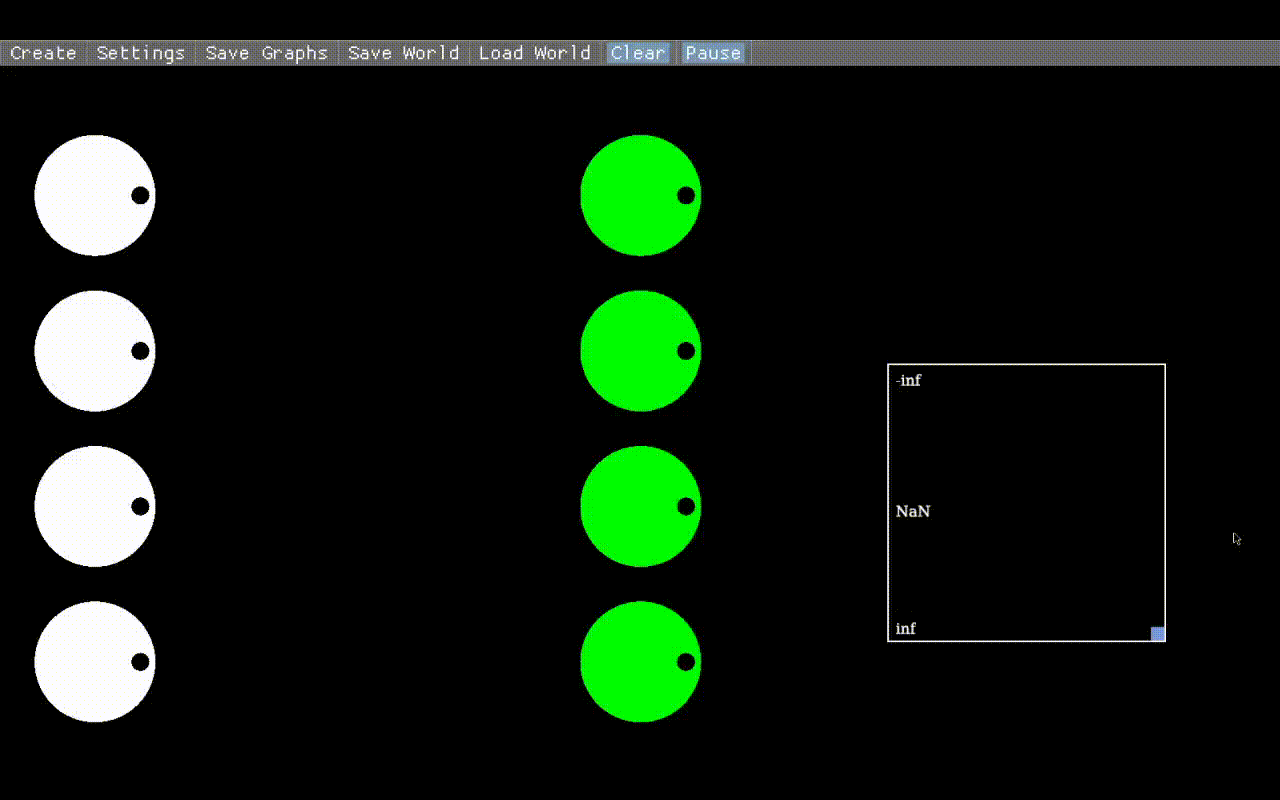
- Without unpausing, right click on the left mass in the row and add an x velocity graph:

- Also add an x velocity graph for the green mass.
- It might be helpful to move the graph using the drag button in the bottom right (left click to move, right click to resize):
- Unpause the scene (graph jittering should be fixed soon)
- Save the graphs to a spreadsheet using the “Save Graphs” button at the top. By default, it will save to “graphs.csv” in the folder that you downloaded the program into. Make sure to pause and save the graph while the time of collision is still shown, otherwise it won’t get exported. Make sure to rename each CSV file so you remember what row it was on.
Data Analysis:
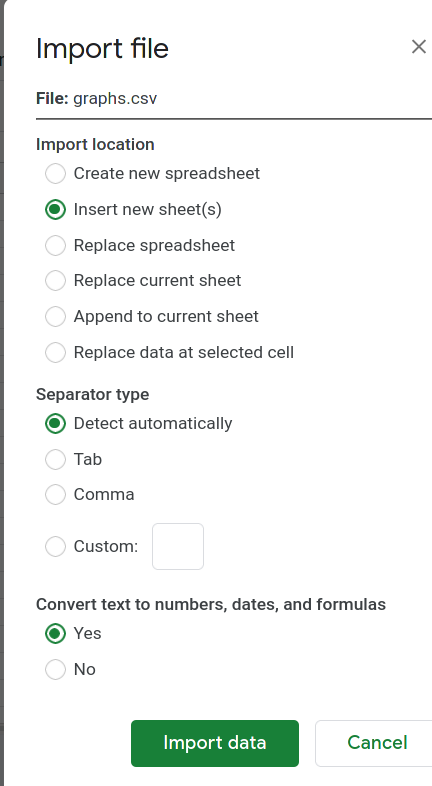
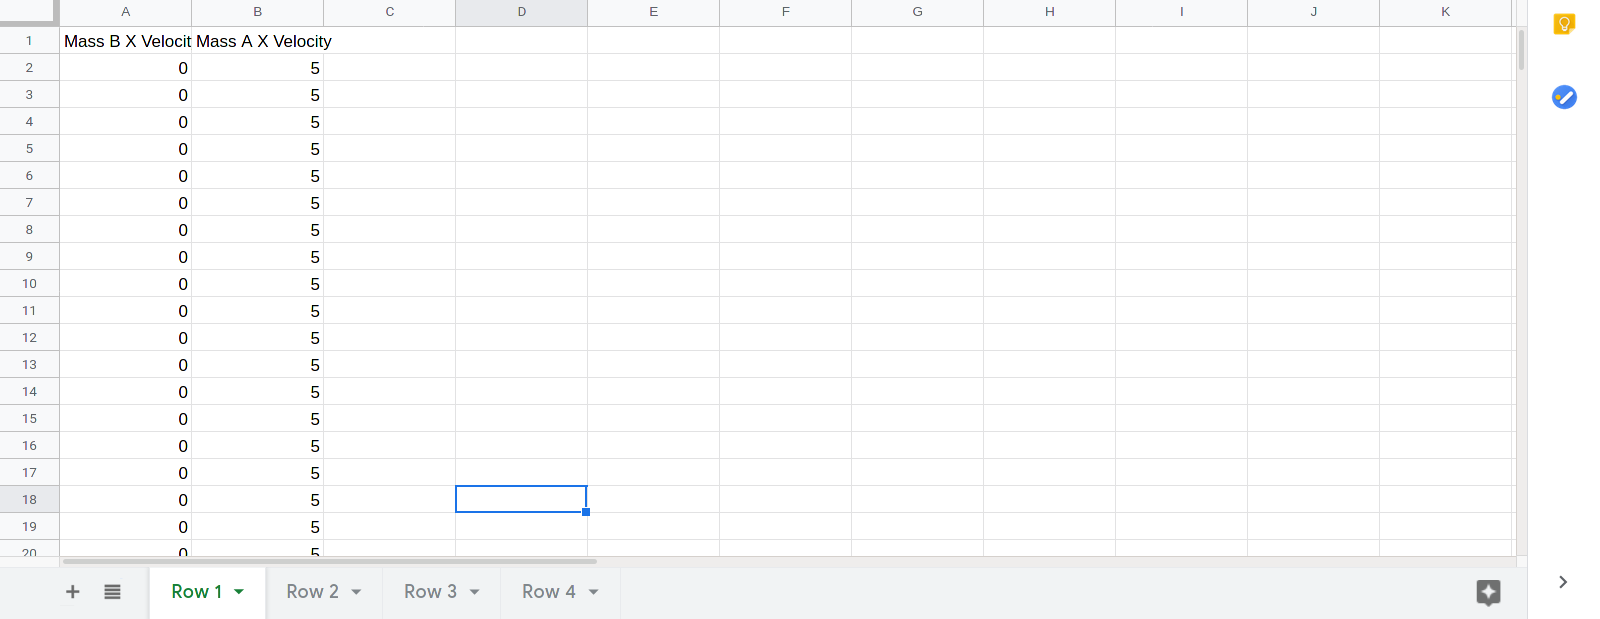
After exporting each row’s graphs, create a new google sheets spreadsheet by opening sheets.new in your browser. To import each csv file, navigate to File>Import>Upload menu and select the file. On the Import File menu, select “Insert new sheet(s)”.
Click the “Import Data” button.
You should have four sheets as shown:
On each sheet, make a line graph of the data. You should be able to clearly see the collision and identify the before and after velocities: 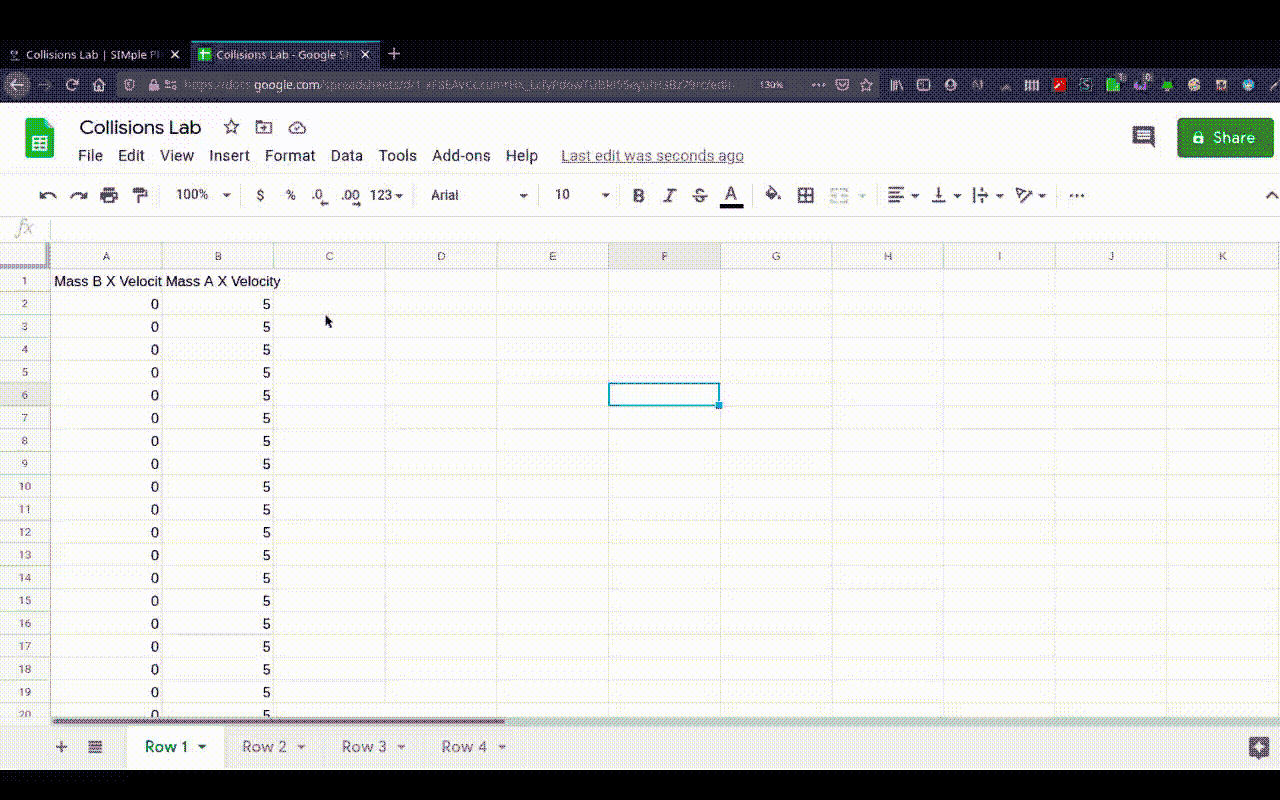
You should be able to make a data table like so:
| Row | Description | \(m_A\)(kg) | \(mB\)(kg) | \(V_A\)(m/s) | \((V_A')\)(m/s) | \(V_B\)(m/s) | \(V_B'\)(m/s) | \(P\)(kgm/s) | \(P'\)(kgm/s) | \(\Delta P\pm\) |
|---|---|---|---|---|---|---|---|---|---|---|
| 1 | Purely Elastic \(m_A = m_B\) | 1 | 1 | 5 | 0 | 0 | 5 | 5 | 5 | 0 |
To complete the lab, fill out the remaining rows, analyze the data, and write a conclusion explaining what the lab demonstrates. Be sure to write about conservation of momentum and the effect of varying elasticity